

Datadog
Improving interoperability within Datadog and the Dashboards customer experience and solving long-standing problems.
ROLE
Product Design Intern
TEAM
June - August 2024
Graphing & Insights
Dashboards Platform
TOOLS
Figma
Datadog
TIMELINE
What is Datadog?
Datadog is a cloud-based platform that provides real-time monitoring and analytics for applications and infrastructure. It helps businesses keep their services and applications running smoothly by collecting data from various sources, such as servers, databases, cloud services, and containers. Datadog then uses this data to create customizable dashboards, alerts, and reports that provide a comprehensive view of the entire infrastructure.
During my internship, I worked on the Dashboards platform, which allows users to analyze data from across an entire system in a single pane of glass.
Project Overview
Dashboards is the “bread and butter” of Datadog, and provides immediately visibility and insight into environments.
Saved Views in Dashboards is a feature that allows users to save sets of frequently used template variable (used to filter a dashboard’s graphs in real-time to visualize sets of tagged objects), which allows customers to easily find the data they care about with just a few clicks. However, Saved Views hasn’t been updated in years and has multiple existing problems, made known from customers and our own engineers, and solving these problems was on the Dashboards’ team OKR for the quarter.
As the lead designer for this project, I worked closely with my UX Researcher, Engineers, Product Manager, and design team to identify the core of these problems and deliver a V1 of the new Saved Views feature for testing in Q4.


BACKGROUND
Saved Views in dashboards is a feature that hasn’t been updated in years and we know has existing problems.

The current Saved Views feature
Saved Views is an five-year-old feature, and has not been updated since its launch in 2019. The Dashboards team has received numerous requests to fix the multiple parts of the Saved Views feature. These included:

DIGGING DEEPER
Conducting User Research
To better understand how Saved Views in Dashboards is used, its pain points, and identify opportunity areas for the team to explore in coming quarters, I worked with a UX Researcher on my team to create a survey.
My goals for this survey were to:
Identify what information of Saved Views would users like to be able to edit
Clarify the relationship between template variables and Saved Views
Identify additional functionality to add to Saved Views to improve the experience for different use cases
I sent this survey to 6 internal users and 4 external customers, and conducted four follow up interviews with respondents.
Feature Use Cases
I talked to multiple internal users of the Saved Views feature in Dashboards (primarily engineers and product managers) and identified use cases. From my survey, I found that respondents use Saved Views to access a particular scope of data, map metric metadata, and for their team to have easy and immediate access to the same datasets.

Identifying these use cases and gathering data on its usage helped me understand what kinds of users we are designing for.
RESEARCH INSIGHTS
From my survey and four follow up interviews, I identified 3 short-term and 3 long-term opportunity areas.
Short-term Opportunity Areas
-
There is no way to edit an existing Saved Views. Users find it annoying to have to create a new view and delete the old view every time they want to edit a Saved View. Users specifically want to be able to edit the name, values, and template variables of a Saved View.
-
Only showing the name of Saved Views in the dropdown makes it difficult to understand what the Saved View shows. Information such as description, a preview, or associated template variables and their values would help users efficiently understand a Saved View.
-
Multiple parts of the UI confuse users on which view they are currently in, if they have made changes in that view, and whether or not they are actively in a saved view. It is not clear to the user that when they change a value in a template variable, they are making changes that are not saved unless they choose to save it as a new view.
Long-term Opportunity Areas
-
“If a dashboard shows info about payment for hiding a view/some variables based on roles could be useful.” - Datadog Customer 1
“When managing a dashboard that is shared with stakeholders that belong to the same organization, we don't want them to be able to change these variables.” - Datadog Customer 3
-
Since deployment code and some datasets already inherently have template variables, automatic Saved Views could be generated using Basil. Removing from deployment code would also remove from the associated Saved View.
-
It’s annoying for users to always switch to a specific Saved View when opening a Dashboard. For larger analytical dashboards or service pages, being able to have a saved view for certain sections that hides or shows specific widgets associated with a view would help users navigate data more effectively.
For the scope of my project, my product manager and I decided to focus on:
Adding edit functionality to Saved Views
Adding context to Saved Views
Clarifying the relationship between Saved Views and template variables
REFLECTING ON RESEARCH
Guiding Ideation with Key Findings
With each opportunity area, I kept in mind the following goals for each opportunity area:

DEFINING SAVED VIEWS
Clarifying the Relationship between Saved Views and template variables
First, I focused on how to clarify the relationship between Saved Views and template variables. I explored the current Saved Views feature and conducted some user testing sessions to identify what parts of the UI was confusing.
I decided to play around with the Saved Views feature myself and noted down the current logic of the relationship between Saved Views and template variables:
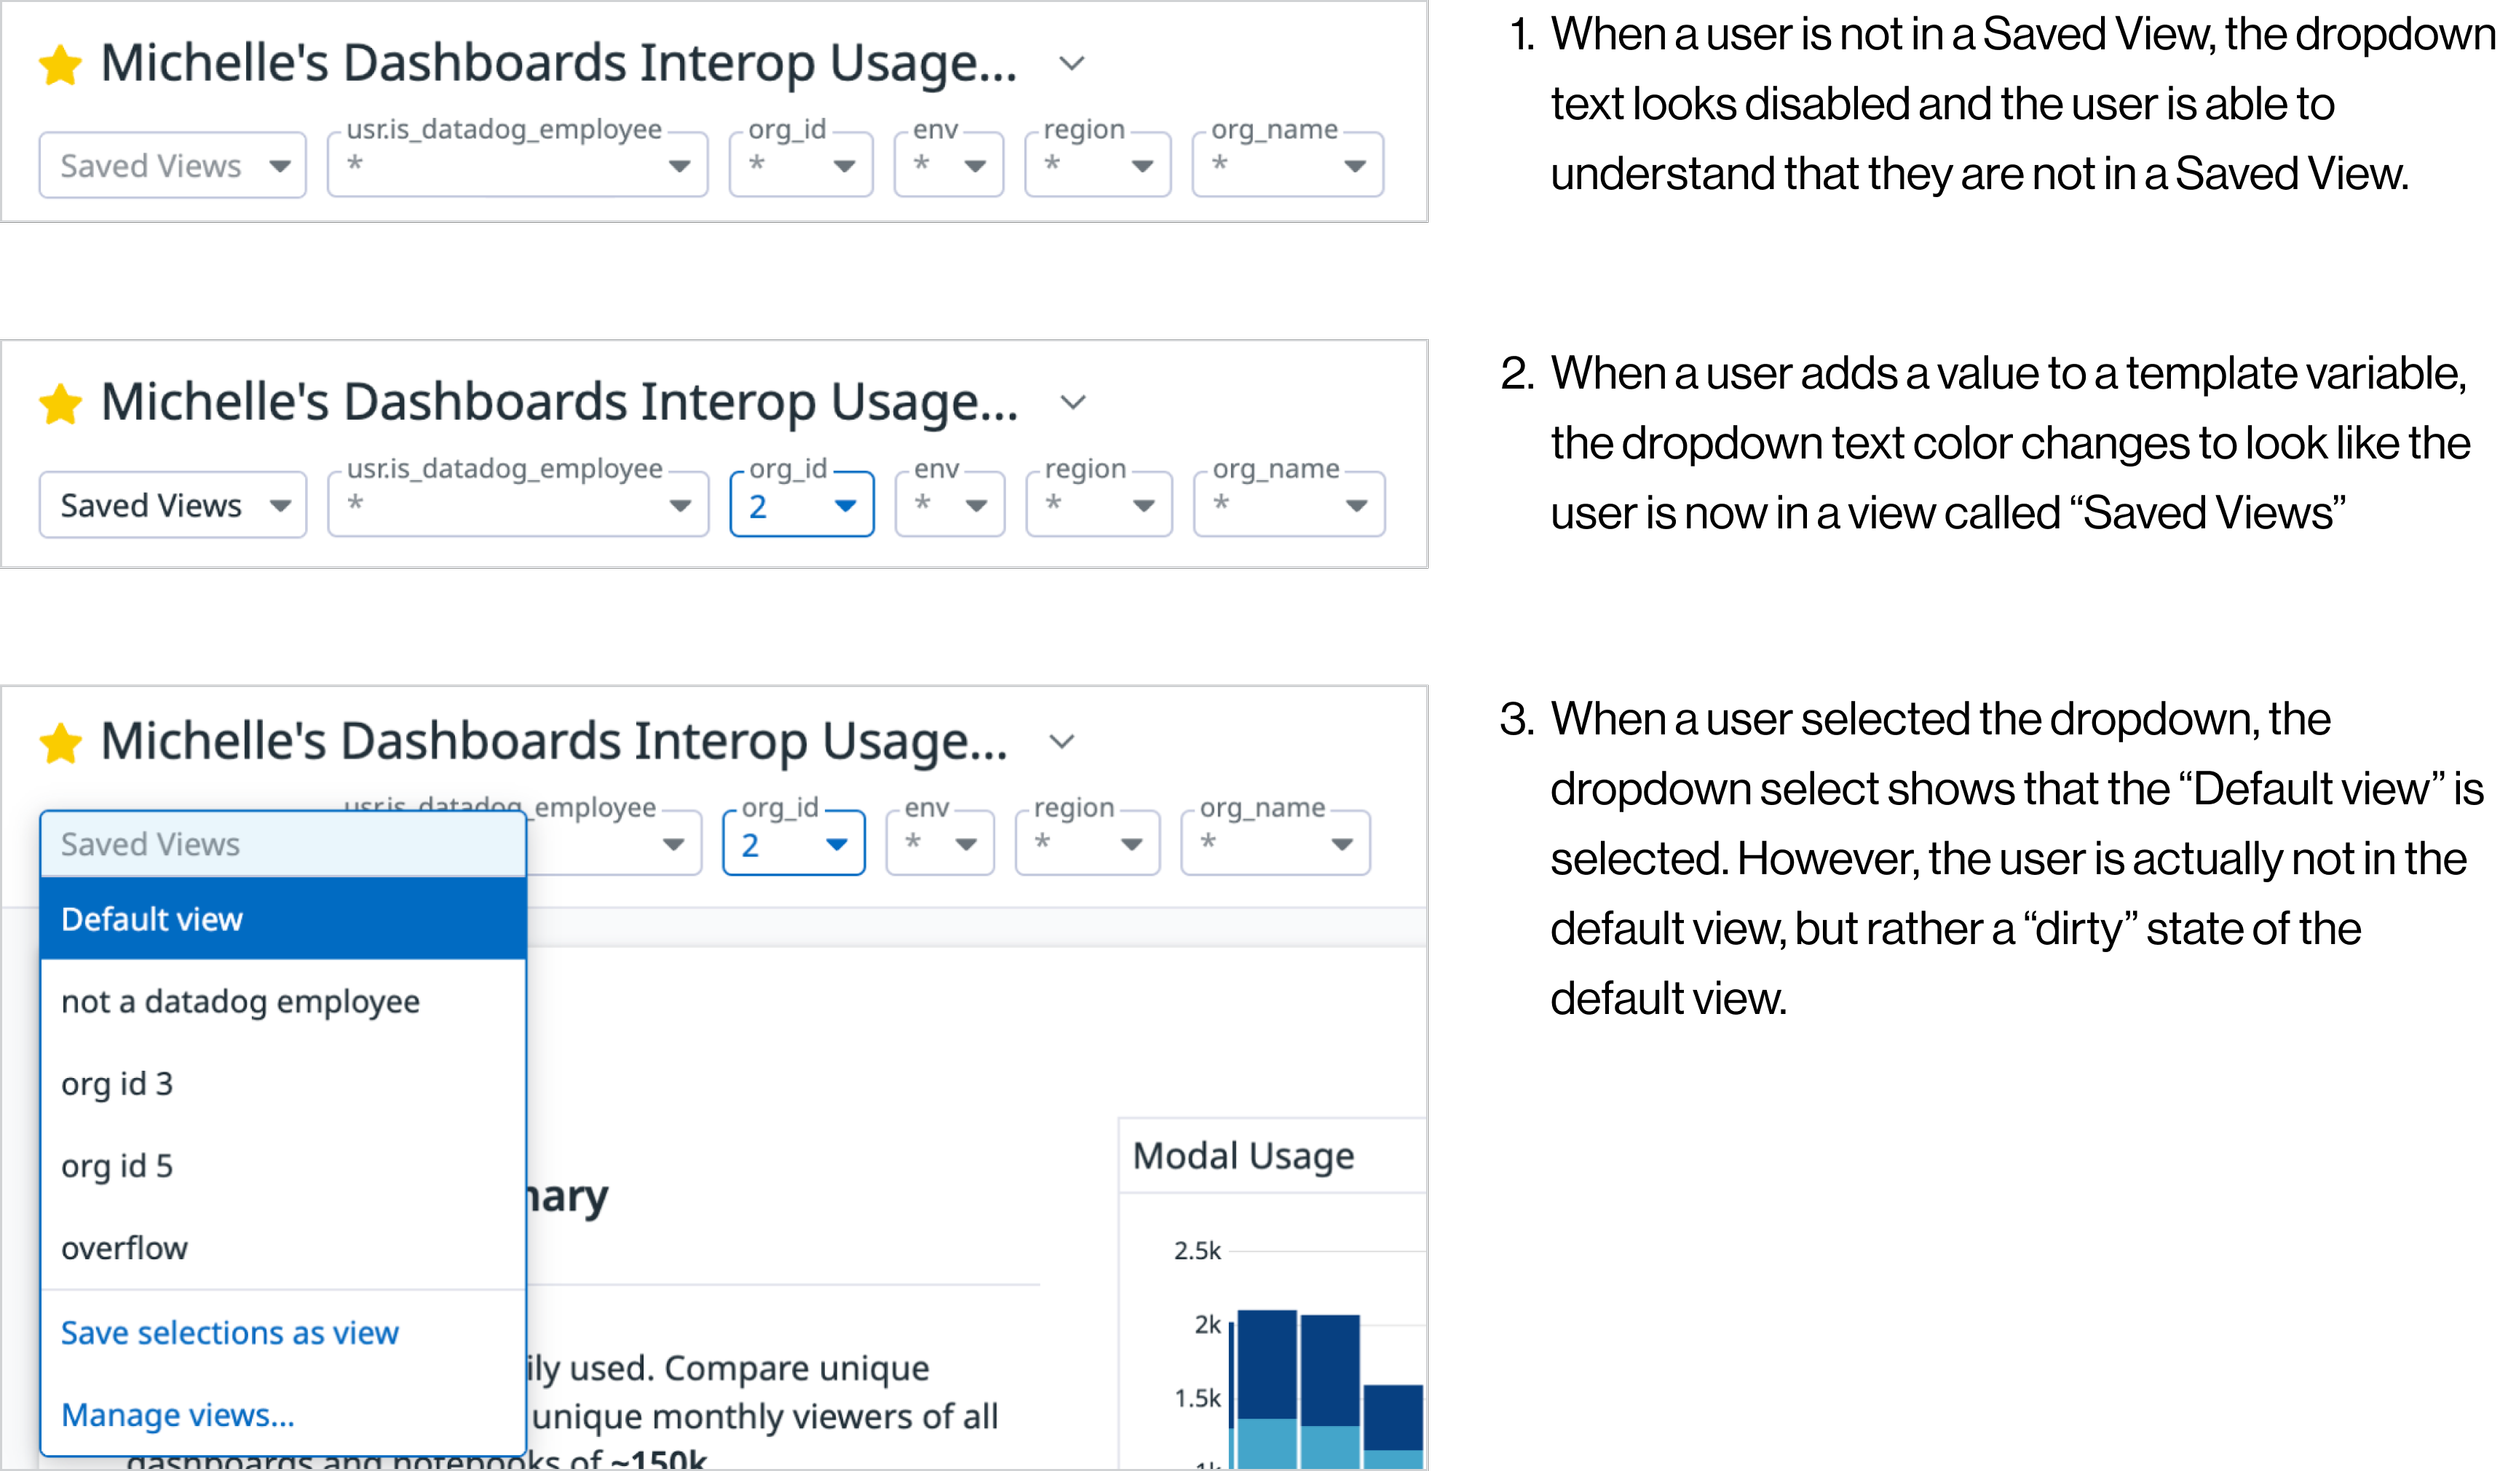
Primary UI text color indicates that the user is actively in a Saved View and has not made any changes.
Secondary UI text color indicates that the user is not actively in a Saved View
If a user makes changes to template variables while in a Saved View, they are instantly removed from the previously selected Saved View and put in a “dirty state” Saved View, which looks like the user is in a view called “Saved Views”.
Thus, there are three possible states a user can be in when using Saved Views:
Not in a Saved View (“Default view”)
Actively in a Saved View
“Dirty state” of a Saved View (from changing template variable values)
The confusion stems from the unaccommodated “dirty state” of a Saved View, where the UI currently shows that the user is in a Saved View called “Saved Views” and the selected view in the dropdown is the “Default view” when they actually are in neither.
UI IDEATION
Thus, to clarify this relationship and clear the confusion, I first explored ways to indicate a “dirty state” within the current Saved Views feature.

Option 1 shows the current UI but with a primary interaction color dot in the corner of the dropdown to indicate changes made. However, since the majority of users often play around with the template variable values to find a specific scope of data, this design brought too much attention to the dropdown and felt more as if there were unsaved changes rather than the user being in a dirty state of the selected Saved View.
Option 3 shows the copy within the dropdown to literally be “No view selected” in the primary UI text color, but was not obvious enough that the user was in a dirty state.
I decided to move forward with option 2, as it was a subtle enough change and aligned best with the current Saved Views logic using the secondary UI text color and italics to indicate that the user has made changes to the selected Saved View.
UI IDEATION
Adding Context to Saved Views
The current Saved Views dropdown does not display any information about a Saved View besides the name. If a user wants to see the associated template variables and values of a Saved View, they must click on the “Manage Views” button at the bottom of the dropdown to see all the Saved Views in a modal.

Current Saved Views Flow
I kept in mind a recent design review by another designer on Saved Views in Logs for queries to inform some of my iterations, and gathered some designs used in other parts of Datadog as references.


Information Requirements
Name
Description
Associated template variables values
I had three main explorations:


References from other parts of Datadog
From my research, I found that users wanted to be able to rename, add a description, and be able to see associated template variables. Put together, Saved Views would need to evolve to include:
Option 2
Follows Saved Views pattern in Logs and Monitors.
Bulky, covers part of the Dashboard.
Makes Saved Views Feature a feature more prominent than it should be.
Feature Requirements
Editing context (name and description)
Editing template variable values
Deleting a view
Option 1
Consistent with the current “Manage Views” modal but displays a description and actions under a kebab icon.
Covers entire Dashboard.
Requires an extra click to open the modal and see the context.

Option 3 ✔
Follows the Notebooks slash command menu.
Feels natural next to the dropdown select menu.
Feels lightweight and easily dismissible with hovering UI. Non-invasive and not bulky.
BUILDING AN EXPERIENCE
Adding Edit Functionality to Saved Views
Designing the editing experience was the most difficult part of this project because of how the Dashboard header is set up. The user needs to be able to easily recognize when they’re in the edit state and not.
Option 1

“Save changes” and “Cancel” button to the right of template variables would confuse the user on what they are editing — the template variables or the Saved View’s template variable values.
Adding too many actions too the header makes it too dynamic.
Unobtrusive — allows users to see live changes to Dashboard widgets.
Option 2 ✔

Altered message box for Dashboards with CTA.
Description helps users navigate the new functionality.
Unobtrusive — allows users to see live changes to Dashboard widgets.
FINAL TOUCHES
Onboarding
To introduce users to Saved Views and any new updates, I created an onboarding section in the preview side of the dropdown when a user hovers over the “Save selections as view” option in the dropdown.
This onboarding section details what Saved Views is and links to Datadog’s docs, describes how to create a Saved View, and updates to the feature.


Saved Views Onboarding
Editing Name and Description
Finally, I explored ways to edit a Saved View’s name and description.
Option 1
Modal editing
Breaks the user’s flow of navigating Saved Views
Prevents user from seeing Dashboard


Option 2 ✔
Inline editing
Seamless integration — feels like a “single pane of glass”
Reduces the disconnect compared to when a modal appears
BRINGING IT TOGETHER
Final Design & Prototype
Creating a Saved View
Editing a Saved View’s Template Variable Values
Editing a Saved View’s Name and Description

FINAL THOUGHTS
Key Takeaways
During this internship, I worked extensively within a large, constantly updating design system for the first time, learned how to present work to multiple stakeholders at different levels frequently for feedback, and conduct customer-centric research. My main takeaways were:
Learning how to find the root problem of an issue and define a scope before jumping into designing.
Feedback is feedback — not an order. Balancing and finding the gold nuggets in feedback from multiple stakeholders is the key to success.
Recognizing when to stray from the design system is necessary to create innovative solutions.
I am incredibly thankful to everyone I worked with at Datadog. Their guidance and support were truly helped me grow as a designer.